 Virto JQuery Charts for SharePoint 1.0.1
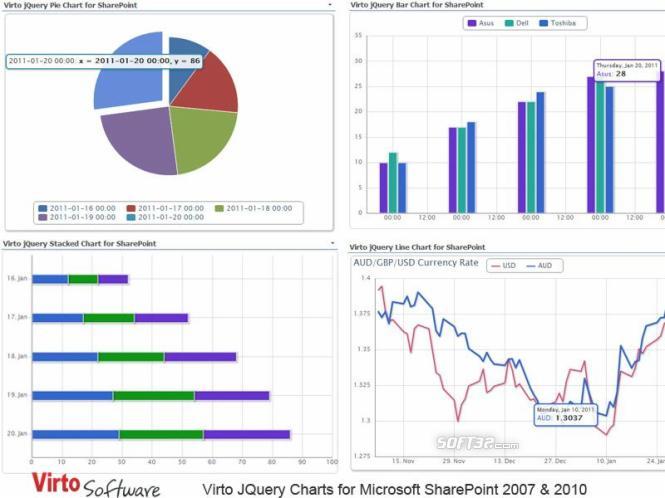
Virto Charts is a jQuery-based control for creating plots, graphs and charts in Microsoft SharePoint. Virto component produces beautiful line, bar and pie charts with many features.
Last update
14 Feb. 2011
Licence
Free to try |
$490.00
OS Support
Windows Server 2003
Downloads
Total: 376 | Last week: 1
Ranking
#1394 in
Other Tools
Publisher
Virtosoftware
Screenshots of Virto JQuery Charts for SharePoint

Virto JQuery Charts for SharePoint Publisher's Description
Virto Charts is a jQuery-based control for creating plots, graphs and charts in Microsoft SharePoint. Virto component produces beautiful line, bar and pie charts with many features. Charts can be based on a variety of data sources, including SharePoint Lists, SQL tables, XML etc. Key Features 1. SharePoint list, SQL database, XML file data sources 2. Ability to define chart height and width or diameter in pixels 3. RGB color coding for line and bar charts 4. Using chart zoom 5. Using stacked chart option 6. Highlighting data points 7. Ability to define colors for grid RGB color coding of X and Y axes 8. Axis auto scaling (automatic definition of minimum and maximum) 9. Showing/hiding chart title and placing it in different positions 10. Showing/hiding chart legend and placing it in different positions 11. Ability to hide data source on chart 12. Filtering options for displayed data 13. Value grouping and data aggregation for Y axis 14. Ability to define data format for X axis of date and time type Editions for SharePoint 2007 and 2010 versions
What's New in Version 1.0.1 of Virto JQuery Charts for SharePoint
First Public Release
Look for Similar Items by Category
Feedback
- If you need help or have a question, contact us
- Would you like to update this product info?
- Is there any feedback you would like to provide? Click here
Popular Downloads
-
 Kundli
4.5
Kundli
4.5
-
 Macromedia Flash 8
8.0
Macromedia Flash 8
8.0
-
 Cool Edit Pro
2.1.3097.0
Cool Edit Pro
2.1.3097.0
-
 Hill Climb Racing
1.0
Hill Climb Racing
1.0
-
 Cheat Engine
6.8.1
Cheat Engine
6.8.1
-
 Grand Theft Auto: Vice City
1.0
Grand Theft Auto: Vice City
1.0
-
 Grand Auto Adventure
1.0
Grand Auto Adventure
1.0
-
 Tom VPN
2.2.8
Tom VPN
2.2.8
-
 HTML To PHP Converter
6.0.1
HTML To PHP Converter
6.0.1
-
 Zuma Deluxe
1.0
Zuma Deluxe
1.0
-
 Netcut
2.1.4
Netcut
2.1.4
-
 Windows XP Service Pack 3
Build...
Windows XP Service Pack 3
Build...
-
 Vector on PC
1.0
Vector on PC
1.0
-
 Minecraft
1.10.2
Minecraft
1.10.2
-
 Ulead Video Studio Plus
11
Ulead Video Studio Plus
11
-
 PhotoImpression
6.5
PhotoImpression
6.5
-
 Street Fighter 3
1.0
Street Fighter 3
1.0
-
 Auto-Tune Evo VST
6.0.9.2
Auto-Tune Evo VST
6.0.9.2
-
 Iggle Pop
1.0
Iggle Pop
1.0
-
 C-Free
5.0
C-Free
5.0